Search Console the Popular Web Admin Tool from Search Engine Giant Google have been triggering positive growth since it’s new version launch.
However, the Search Console’s native user interface is not cool to work with, and hence it is important to integrate the same with a better dashboard and reporting tool for better data analysis marke8now
For benefitting the most out of Search Console, especially with Performance Data, we need to:
- Extract parts of this rich data source
- Present it in compelling dashboards, such that the clients, management and other stakeholders can get a quick overview of organic insights.
By employing these simple steps, you can get the most out of Search Console by combining it with Google Data Studio.
custom Search Console dashboards can benefit us in several ways like.
- Incredible amount of time can be saved by surfacing organic issues, fluctuations, and insights faster.
- Fare Goodbye to boring reports and create visually compelling reports that can influence and persuade your customers
Popular ways of connecting with Google Data Studio:
There are 2 popular ways of connecting with Google Data Studio.
Native Connector:
This is the most obvious way of connecting Search Console data with Data Studio, by using the native connector to create a data source.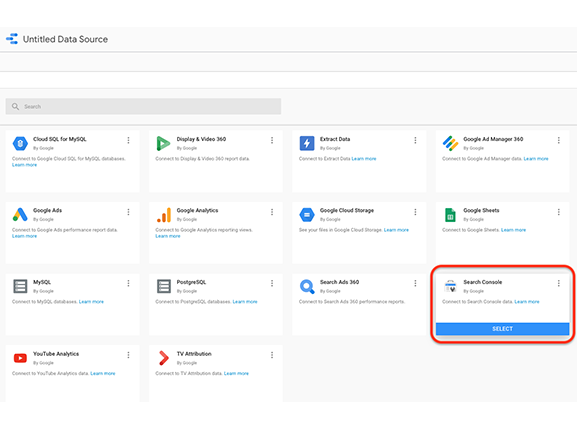
While this connector is considered to be a quick and easy option for getting Search Console Performance insights into Data Studio, there is a catch as well.
The issue here is that we can get only performance data with only a limited number of dimensions.
Third-Party Tools:
We can choose from several Third-Party Tools for integration. By employing third party tools one can get access to- Sitemap metrics and Performance data.
- A wide range of dimensions to help you slice and dice the data as required.
Types of Search Console Dashboards that Can be Build in Data Studio:
There are two main dashboards that can serve different purposes and communicate different aspects of Search Console data.
Top Level Trends Dashboard:
This Dashboard provides a high-level overview of website’s organic performance. Along with support to SEOs and Digital Marketers, this can be equally shared with management, clients and other stakeholders who have a limited understanding of organic search.
Here is what the Dashboard is comprised of:
Sitewide Trends: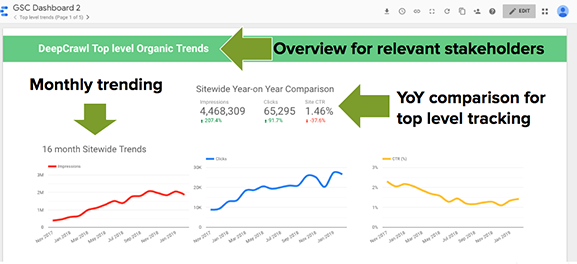
This Dashboard provides a sitewide year-on-year comparison scorecard to show how the overall site is performing in terms of impressions, clicks, and CTR compared to the previous year.
Also included, sitewide impressions, clicks, and CTR are trended on a monthly basis to clearly show the overall direction of organic performance.
These graphs can provide a great relief by removing the noise of the daily trending that you are locked into within Search Console itself. This can help in visualising the info as clearly as possible.
Branded & Non-Branded Trends
Splitting the Performance Data into Branded & Non-Branded is important, as each of them could be telling different stories.
While Branded Search speaks of overall marketing efforts of a site and their success in growing brand visibility, Non-branded search performance is more indicative of the effectiveness of SEO work.
Directory Breakdown
Directory breakdown is yet another useful way of breaking performance data in top-level, by splitting out clicks & impressions by site sections and trending this on a monthly basis.Setting up this can help you to present how various sections on a site are contributing to the overall organic performance and how this has changed over time.
Long Tail vs. Short Tail Performance
Similar in the lines of Directory Breakdown, query length can also be used as a dimension to gain an understanding of long and short tail performance.This could be taken one step further, by bucketing together different query lengths to group short, mid and long tail queries.
Monthly Trends This dashboard covers 2 comparison scorecards with month-on-month and year-on-year comparisons of impressions, clicks, and CTR.
The Dashboard also features three graphs showcasing performance data on a daily basis to identify more immediate fluctuations.
Device, Geographic & Search Type Trends:
These graphs are configured to detect changes in various types of organic traffic. This is useful for flagging the source of fluctuations in organic traffic and forming the basis for further investigation.
Page & Query Performance:
This dashboard provides insights to the top performing pages and queries for the last month, with a comparison to the previous month.
Interestingly this information can also be obtained from the Search Console UI, however
this dashboard can help you in saving your time as you don’t have to configure filters such as date ranges each time.
Biggest Winners & Losers:
These are the tables that are showing the biggest changes comparing last month to the previous month.
While the biggest winners are queries that have seen the biggest increase in clicks, impressions, CTR and average position, the biggest losers are those that have seen the biggest decrease.
Interestingly these tables are available in the previous search console itself, however it’s handy to have these pre-configured in a dashboard ready for reviewing on a monthly basis.
Fraggle Performance
Fraggles are actually another name for the jump links in SERPs that deep link to specific sections of a page.
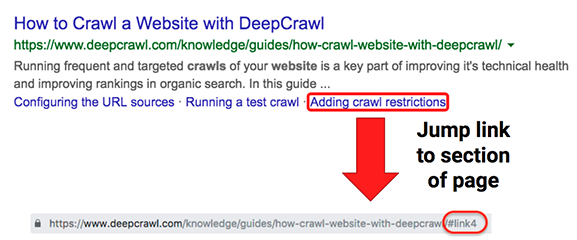
Fraggles are particularly useful for sites with a lot of long-form content, as they help get searchers to the information they want faster.
While Configuring of these Dashboards appear to be a tedious, once they are done, every report will be automated, you can reap the benefits in terms of time saved in the long run.
We at Marke8Now can help your business to grow, by providing an amazing array of Customer Centric Strategies with wide range of Digital Marketing & Development Services including Web Analytics, Branding, Social Media Marketing, SEM/PPC, SEO, Web & Mobile Application Development, etc.
Do visit our website at http://marke8now.com for further details and reach us at (+1) 832 906 7001 or e-mail us on info@marke8now.com
Contact US